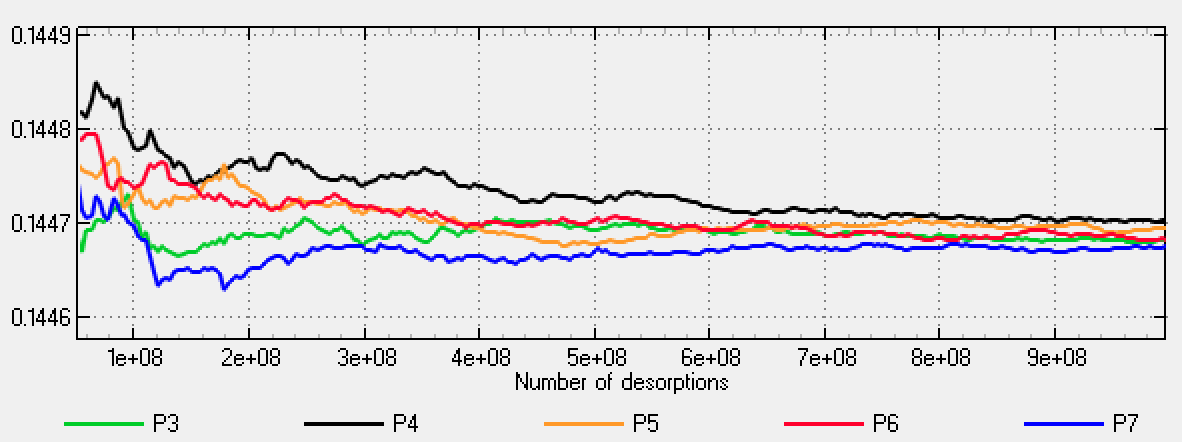
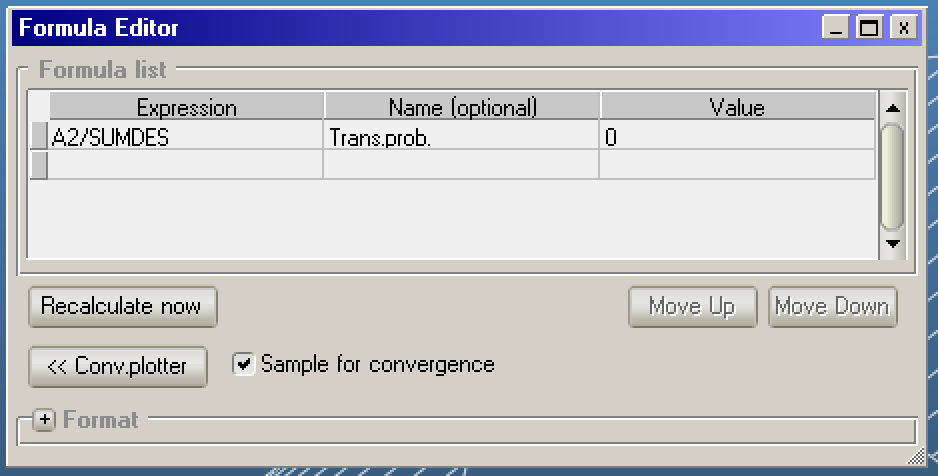
Following another user request and the wish to compare different configurations more easily, we created a new analysis tool: the Convergence plotter. As it is deeply entangled with the Formula Editor, you can open it directly from there (or via the Tools menu).
Once activated (on by default), all formula values will be sampled with Molflow's default sample rate (1 per second). For each formula an individual plot can then be generated in the new Convergence plotter window:
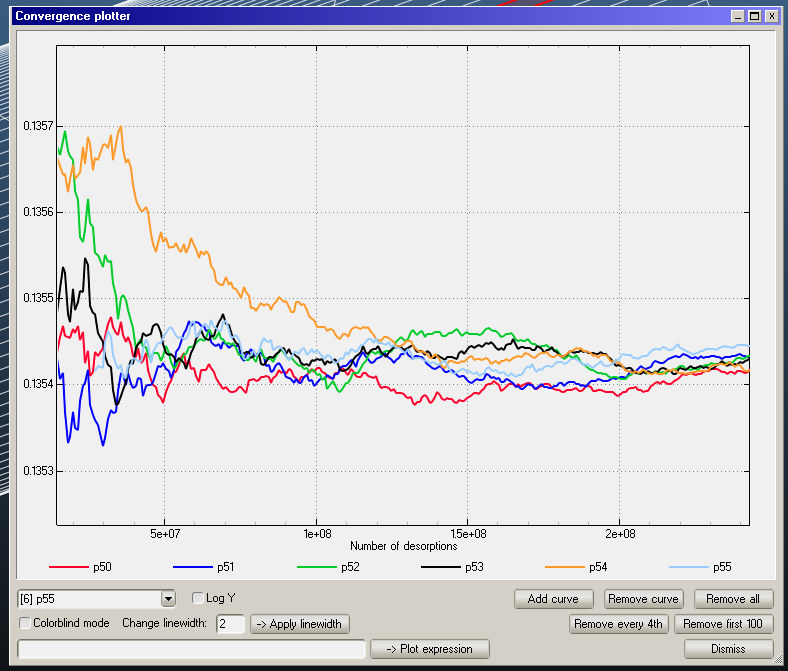
The plotter automatically zooms into the last 1000 sample points, but there are also options to prune unwanted data points.
- Remove every 4th: Smoothens the plot by removing every 4th sample point from beginning to the end.
- Remove first 100: Removes the first 100 sample points, which can be useful to skip the early intervals which usually have a large deviation. Removing these will quickly highlight more fine-grained changes on later sample points.
Sample points will automatically be saved with XML file format. Which can be useful for further analysis. In case a lot of formula values are needed, while convergence plots are not, it is advised to turn of sampling. This will prevent large data dumps from being saved.
Upcoming features
The convergence plotter is only the first step and helps to visualise, when simulations are sufficiently precise and thus can be stopped. We are currently investigating and developing some criteria, which will give an automatic assumption, whether the formula values have converged up to a certain level or not. Defining such a stopping criterion will also give another option to automatically stop the simulation -- so far it is only possible to define a desorption limit (see Global Settings).