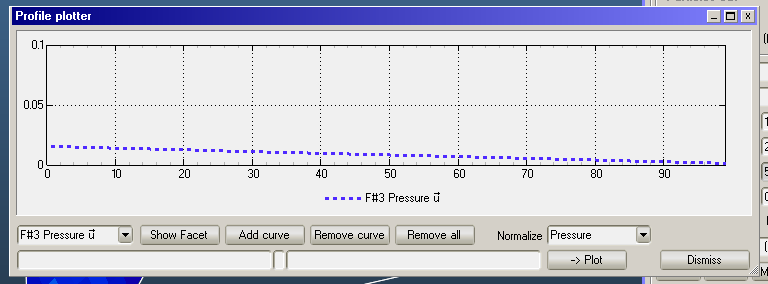
Shows the pressure distribution on a given direction of a facet. To use this function, first you have to set profile counting on the given facet's parameter panel.
Adding a profile plot:
- Select the facet whose profile you want to add to the graph
- Show facet selects this facet (to know where it is), while Add curve adds its pressure profile to the graph.
- Right-clicking on the chart allows you to customize its display properties:
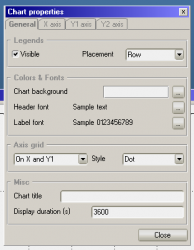
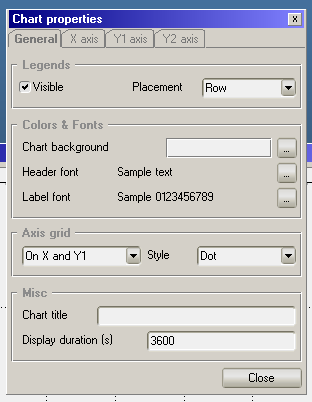
The last line allows you to plot a simple mathematical function, for example sin(X) for comparison with pressure values.