Following user requests, a diagnostic tool has been added to Molflow, providing insight to the behavior of your vacuum system. It can show the dsitribution of the...
- number of bounces
- flight distance
- flight time
...of test particles until they are pumped:
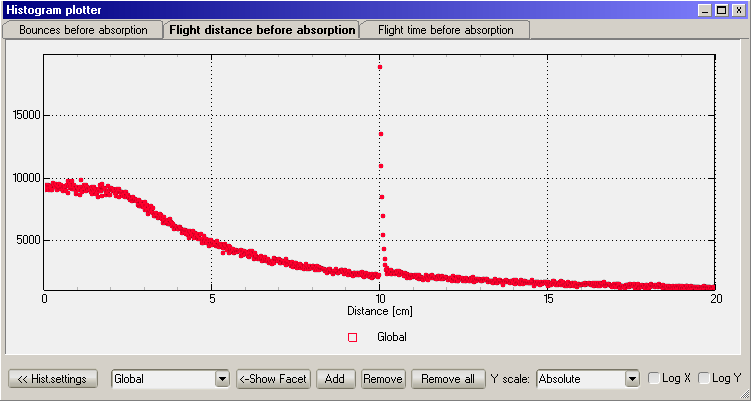
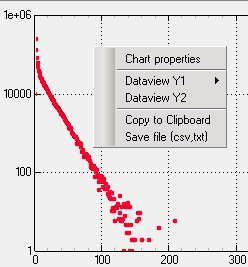
Flight distance distribution in a 10cm long pipe. Note the spike at 10cm (pumping after flying directly into the pump at the opposite end)
To set up histogram recording, expand the settings panel with the button on the lower right corner:
The settings panel defines histogram properties either globally or for selected facets:
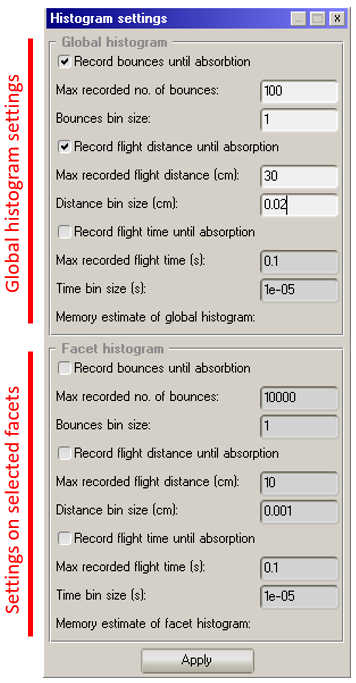
Global parameters allow to record test particles absorbed anywhere.
Facet parameters only record on chosen facets/
If you add histograms to all pumping facets, the sum of the facet histograms equals the global histogram.
Please note that only absorptions are recorded. This seems restrictive but it's the only way to assure that one particle isn't adding more than one data point to the histogram (otherwise a facet with sticking=0.01 would register the same particle 100 times on average).
As for any histogram, you have to define two parameters:
- Histogram cutoff (maximum) value: the largest recorded value of the histogram. Note that there is an extra bin counting "out of range" particles, i.e. if your histogram counts up to 1000 bounces, there will be 1002 bins: those corresponding to 0,1,2,...,1000 and "more than 1000" bounces
- Histogram bin size: the width of each bin. For example, if it is 10 bounces, with a maximum of 1000 bounces, you'll have the following bins:
- 0..9 bounces
- 10..19 bounces
- ...
- 1000..1009 bounces
- 1010 bounces or more
To show the histograms, the plotter has 3 independent charts for bounces, distance and time. You have to add each recorded histogram (global or facet-based) to the plot:
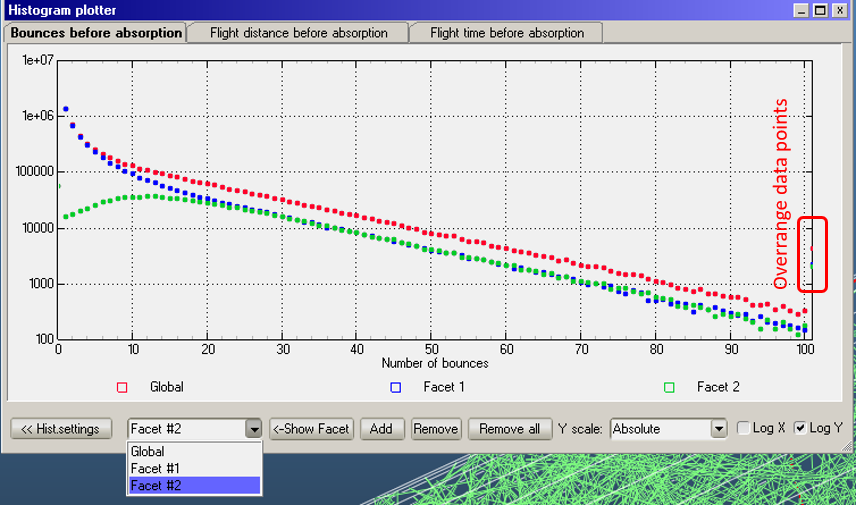
If your max/bin width combination would result in more than 1000 bins, you'll get a warning that only the first 1000 bins will be plotted. Please be aware of this, otherwise you might mask, for example, the "overrange" bin.
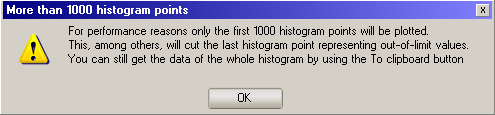
(Note: this check is only performed when adding a plot to the plotter. If the chart is already plotted and you change the histogram parameters you won't have this warning)
You can, however, still export recorded data by right-clicking on the plot (clipboard or text file):
Recorded histograms are saved with the geometry if you use the xml/zip save file format (the default).